Test for Outliers
Outliers or extreme value are numbers or values in a dataset that is often too big or too small when compared to the others.
For example, suppose we want to determine the average monthly income of 15 employees in an organization with the expectation that the average income will be 1,000 USD. But we noticed one particular employee’s monthly income is 15,000 USD. Including this person in the computation will increase the average income to 5,500 USD. It is up to the researcher to decide whether 1,000 USD or 5,500 USD is the true average income of these employees. Now, if this employee is the only one with the highest monthly income, (s)he can be exempted from the calculation, otherwise (s)he can be retained.
The presence of outlier in your data can lead to so many problems – skewness and/or kurtosis - distorting or influencing the shape of your data’s distribution. It is very important to check for the presence of outliers in your survey data.
However, this may not be necessary especially when the questions in your questionnaire are restricted within a certain scale and are designed, distributed, filled and submitted online without the researcher having to do any data imputation.
How to do this in SPSS?
For this example, in our questionnaire, respondents were asked to input their ages. That means, there is a possibility of collecting data from a respondent who is either too old or too young and (s)he could be a potential outlier. Even so, it is also possible a respondent might wrongly input his or her age; or may be due to data entry error. For instance, instead of typing 19, he/she could mistakenly type 9 or even 99.
Let see how we can detect these outliers in our dataset using the Box plot function in SPSS.
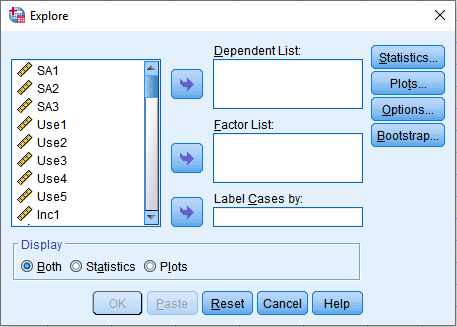
- In SPSS, click Analyze → Descriptive Statistics → Explore. You will be presented with the dialog box below.
- Move Age into the Dependent List:
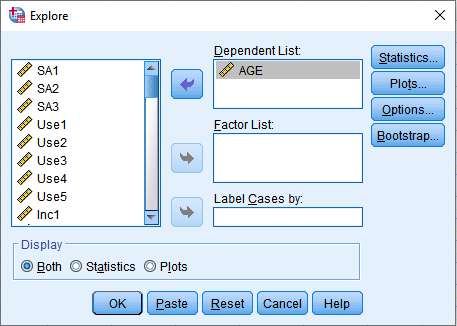
- Leaving everything at default, Click OK.
In your output, we are interested in the box and whisker plot as shown below.
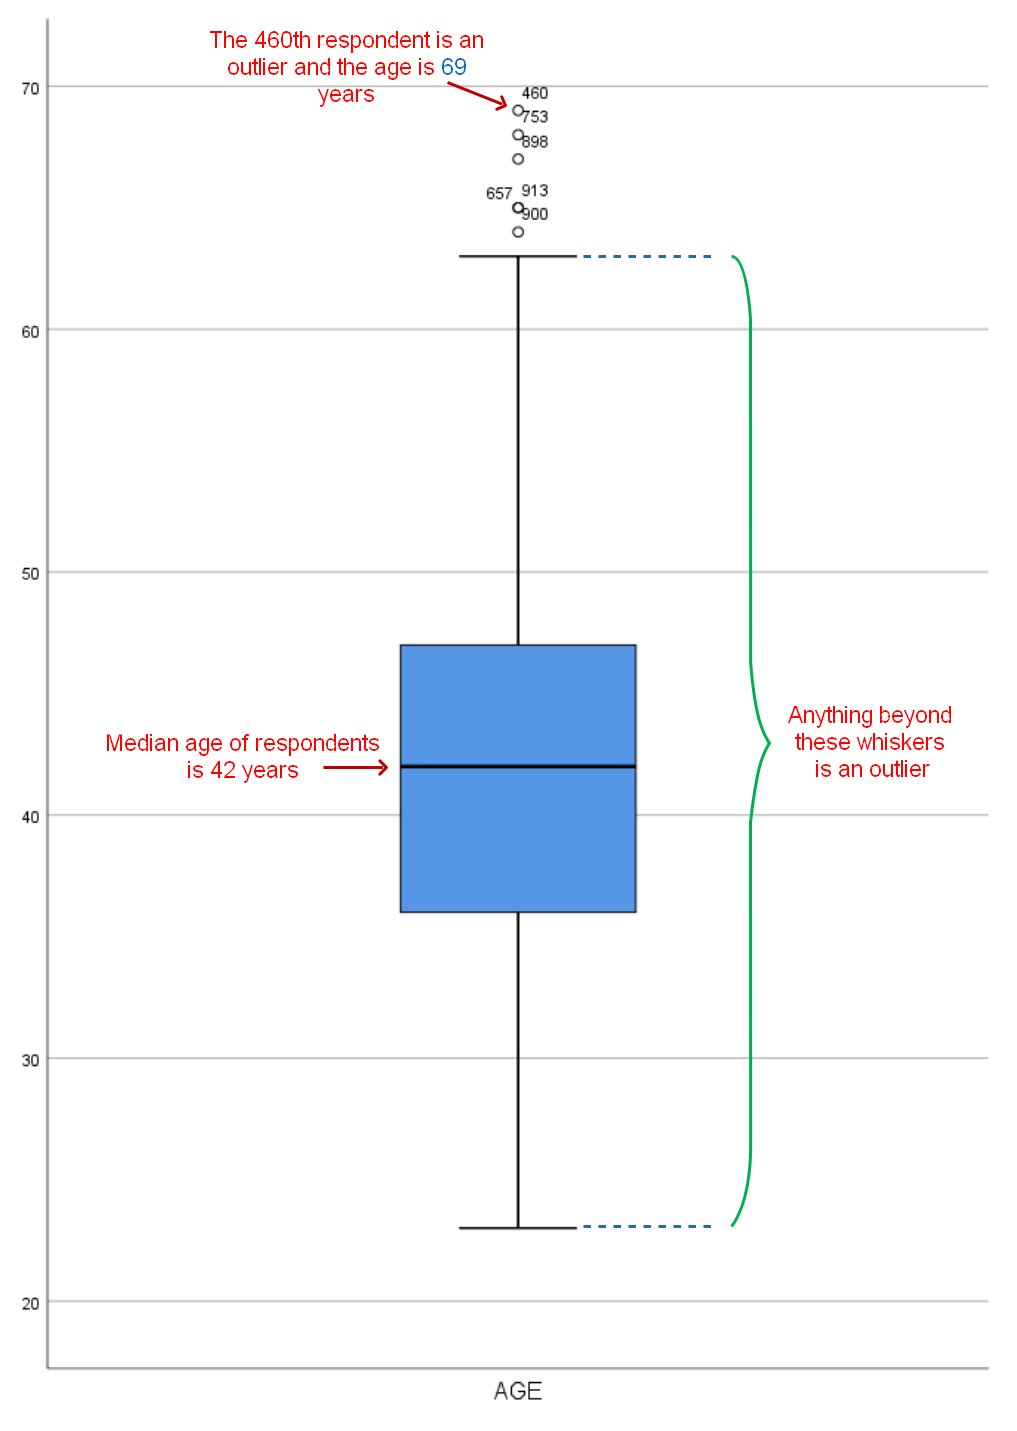
A quick way to understand this: from the box and whisker plot, any number that falls beyond the whiskers of the box is considered an outlier. From this plot, we have six potential outliers, for example, the 460th respondents in the dataset is 69 years old and a potential outlier. Given that we are talking about faculty members in a university, it is laudable to have older people who will definitely participate in the study. On the basis of this, I consider these people not to be an outlier.
It is important that the researcher exercise his judgement on some of the outputs to reflect the exact purpose of the studies.