Confidence Interval
A confidence interval is a type of statistical interval computed from observed data. A confidence interval consists of a confidence level expressed in percent. In most statistical software, by default, the confidence level is 95%. However, you can use any confidence level you desire such as 80%, 90%, 99%, etc. and this is usually decided prior to the analysis of the data. Since it is an interval, it has a lower bound/level/limit and an upper bound/level/limit.
Now, what does it mean to have a 95% confidence interval?
Let me illustrate this with an example, assuming in a study to determine the height of Grade 5 students, you took 40 different samples of the same size from the population and for each time a sample is drawn, you compute the confidence interval (can be done by any statistical software), we expect 95% (i.e.38 out of the 40 samples) of these intervals to contain the true population mean. So, 5% (i.e. 2 of the samples) of these intervals would not contain the true population mean.
Another example: imagine the weight of students in a Grade 10 class have a sample mean of 35 kg and with the help of statistical software, you constructed a 95% confidence interval and find that the lower and upper bound of the confidence interval are respectively 30 and 42 kg. What does this 95% confidence interval mean? This means that we are 95% confident that the true population mean of the weight of Grade 10 students lies between 30kg and 42kg.

As a follow-up, suppose the confidence interval computed has a lower and an upper bound of 38kg and 47kg respectively, again what does the 95% confidence interval tells us? This means that we are 95% confident that the population mean does not lie between 38kg and 47kg.

Now, considering research in the social sciences, supposed you hypothesized that
H1: Business ties have a positive influence on a firm performance
H2: Political ties have a positive influence on firm performance
The SPSS output for this hypothesis is shown below.
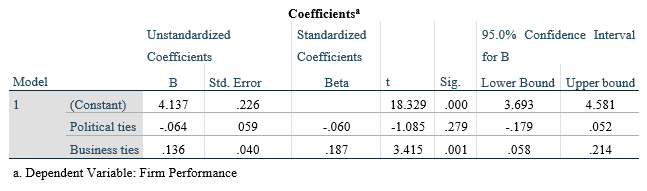
How do I interpret this result?
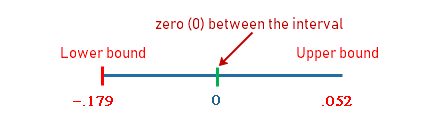
The approach to this is slightly different but the same logic. From the table, a 95% confidence interval for Political ties has a lower and upper bound of -.179 and .052 respectively. This interval has zero in between - there is a possibility of the null hypothesis been supported, i.e. Political ties do not influence Firm Performance. So, we reject hypothesis 2 (H2).
In the case of Business ties, a 95% confidence interval has a lower and upper bound of .058 and .214 respectively.
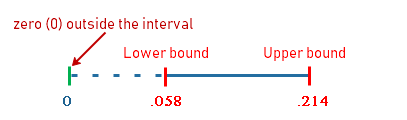
This interval does not contain zero and it is a clear indication that there is enough evidence in support of the hypothesis H1. Thus, we are 95% confident that Business ties have a positive influence on firm performance.