The meaning of R, R Square, Adjusted R Square, R Square Change and F Change in a regression analysis
Concepts can be easily understood when they are explained in a non-technical way with good examples. We explain what these terms mean using a very simple example.
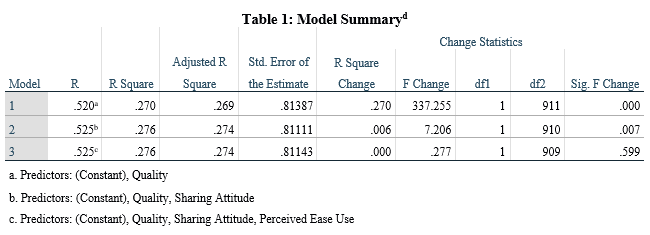
A researcher is interested in examining university faculty user behaviour of information in Wikipedia as a teaching resource using variables such as Quality, Perceived Ease of Use, and Sharing Attitude of faculty members towards information in Wikipedia. Using these variables, the researcher conducted a multiple linear regression and the output summary is shown in the table below. Variables in the model include:
Independent Variables (Predictors):
- Quality of information in Wikipedia
- Sharing Attitude of faculty members and
- Perceived ease of use of information in Wikipedia
Dependent Variable (Outcome): University faculty member’s User Behaviour
R
R in a regression analysis is called the correlation coefficient and it is defined as the correlation or relationship between an independent and a dependent variable. It ranges from -1 to +1. An R-value of -1 and +1 indicates respectively a perfect negative and positive relationship between the independent and dependent variable. Thus, an R-value of 0 shows that there is no relationship between these variables. So, depending on your study, the higher the R-value, i.e. closer to -1 or +1, the better the relationship. Most often, it is expressed in percentages.
From table 1, in the first Model, there is a positive relationship between the Quality of information in Wikipedia and the University faculty member’s User Behaviour. In other words, there exist a 0.346 (34.6%) chance that the Quality of information in Wikipedia will enhance the user behaviour of University faculty members.
In the Second Model, both Quality of information and Sharing Attitude have a positive relationship with User behaviour. Their combined effect has a 0.374 (37.4%) chance of increasing User behaviour.
In the final block, there is a 41.9% chance that all the predictor variable increases user behaviour of University faculty members.
R square
It is also known as the coefficient of determination explains the variations in the dependent variable accounted for by the independent variable. It ranges from 0 to 1 but typically expressed as a percentage during interpretation. It is obtained by squaring the R-value described above. In our example,
If R = .520 ; then R square $= .520^2 = .270$
Also if R = .525 ; then R square $= .525^2 = .276$ etc.
So, in model 1, an R square of .270 means 27.0% of the variation or change in User Behaviour is accounted for by the Quality of information in Wikipedia. Similarly, in model 2, 27.6% of the changes in User Behaviour is accounted for by both Quality of information in Wikipedia and the Sharing Attitude of University faculty members.
Finally, we can see that 27.6% of the changes in User Behaviour is accounted for by all the predictor variables in our model. In other words, the R square value is not different from the one in model 2, so Perceived ease of use added no change to the study model.
Since this is about human behaviour and because there are several uncontrollable factors influencing User Behaviour, it is reasonable for the predictor variables to have a 27.6% change in User Behaviour.
Adjusted R Square
Assuming you need a higher R square value, you can simply increase the number of independent variables in your model. In other words, R square increases with an increase in the number of independent variables. To curb this situation, an adjusted R square was introduced. Adjusted R square, as the name implies, adjusts the number of independent variables in the model and only improves when the new variable added improves the model; decreases when the new variable does not affect the model. Most often, adjusted r square is reported for a sufficiently complex model with a lot of predictors.
In our example, each of the predictors added with the exception of Perceived ease of use improved the model, hence the adjusted r square increased. Thus, in our case, 27.6% (see block 2 or 3) of the variations in User Behaviour is explained by Quality of information in Wikipedia and the Sharing Attitude of university faculty members.
#R Square Change You see, as you keep adding more variables to your model in what we called hierarchical regression analysis, you may be interested in finding out the contribution of the new variable in the model.
For example, when Sharing Attitude was added to Quality in model 2, the change in r square was 0.006 meaning Sharing Attitude contributed 0.6% of the variation in User Behaviour.
F Change
An F change is a test based on F-test used to determine the significance of an R square change. A significant F change implies the variable added significantly improves the model prediction.
From this explanation, it is easy to see that each of the variables added in block 2 (Sharing Attitude) is significant at a p-value of 0.007. Also, the variable added in block 3 (Perceived ease of use) is not significant since the p-value is greater than 0.05. In other words, only one of these new predictors influences User Behaviour.