Missing Value Analysis (MVA)
Missing value or data is the absence of a datapoint in a dataset. The problem of missing value occurs when a respondent fails to answer a question or a data entry problem on the part of the researcher or errors in the data collection process. Endeavour to always conduct a missing value analysis as part of your data cleaning process to avoid getting a false positive or negative result. There are two ways of looking for missing values in your data:
- Across variables (column-wise approach)
- Case by Case or Respondent by Respondent (row-wise approach)
It is possible to conduct a missing value analysis in SPSS for each variable (Across variables). However, SPSS does not provide a function for analysis missing value case-by-case or respondent-by-respondent, hence we shall use excel for this purpose.
MVA: across variables in SPSS
In SPSS Click Analyze → Missing Value Analysis
You will be presented with the dialog below.
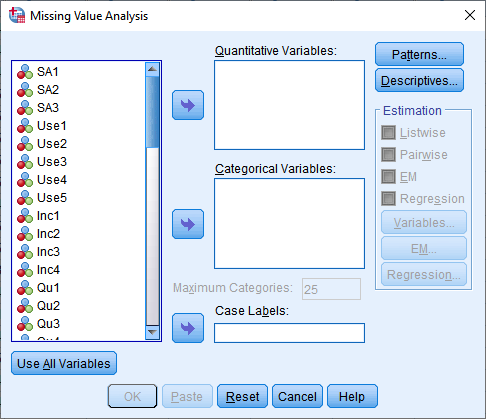
Move all the items into the Quantitative variables: section as shown below.
Alternatively, you can move variables such as Age, Gender etc. into the Categorical variables: section.
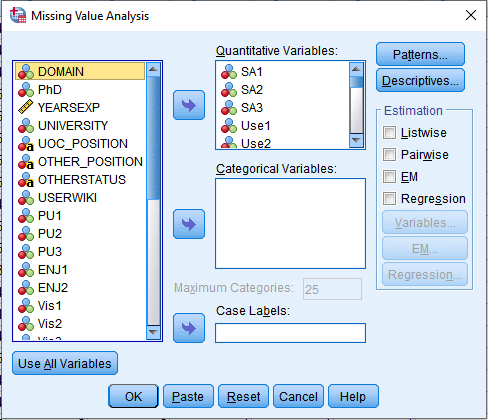
Then Click Ok
You will be presented with the output below.
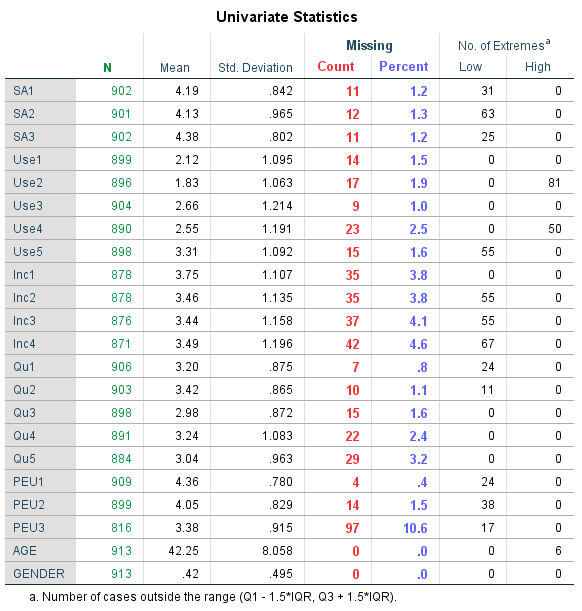
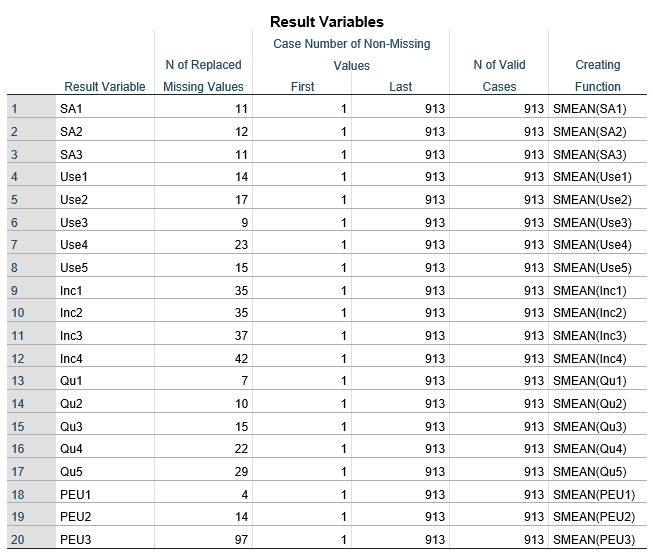
Wow, all the items except Age and Gender have missing values. The column with the label Missing, consist of the number of missing items (count) and its corresponding percent. For example, PEU1 has the least number of missing value (4) representing .4% of the total sample size (913) and the PEU3 has the highest number of missing value (97) accounting for 10.6% of the total sample size.
Even though our sample size is large enough, we are restricted by the number of variables we have in the study and it is not plausible to delete any of them. So, I will prefer replacing them using then steps below.
How to replace Missing Values across variables
To replace these values, in SPSS, click Transform → Replace Missing Value
You will be presented with the dialog below.
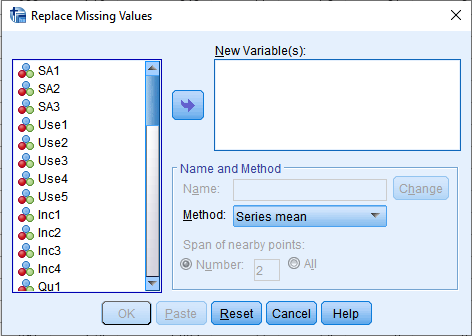
Now, to replace the Missing values for all the items with missing values, move all of them to the New Variable(s): section as shown below.
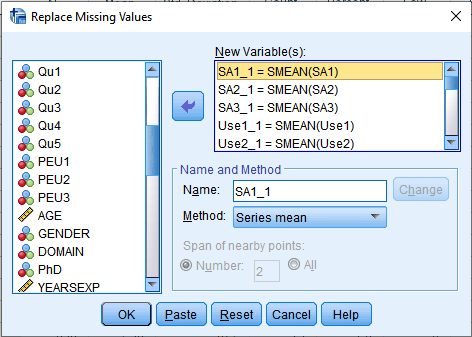
In the Name and Method section, SPSS permits you to change the name of the variable to whatever you want. To avoid duplication and confusion, I will change the name of each of the item to their existing names. For example, I will change SA1_1 to SA1, SA2_1 to SA2 and so on.
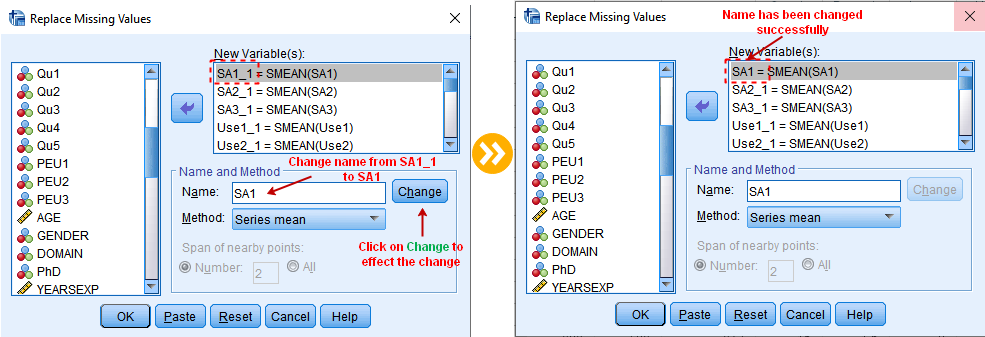
Repeat this action for each of the variables.
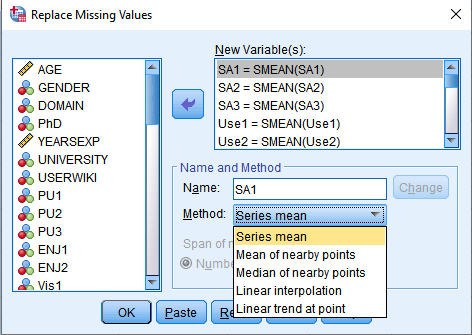
You can also change the Method for replacing the Missing Value. By default, it is set to Series mean. I prefer this method; you can change to whatever method suitable for you.
When you are done with all the changes, Click OK.
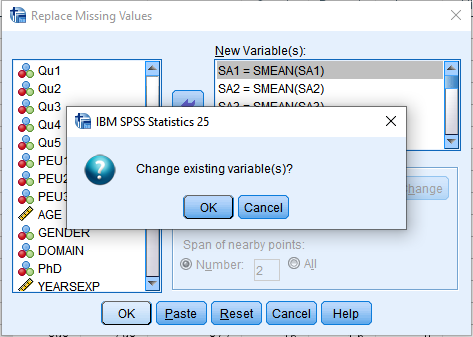
If you change the name to the existing item name, you will be prompted to Change existing variable(s), click OK to proceed.
The final output is a report showing the number of replaced missing values, number of valid cases etc. as represented below.
MVA: Case by Case in Excel
Now, come to think about this, what if we want to know the number of missing values for each respondent. In other words, the number of unanswered questions by respondents. SPSS does not have the required functionality for this. So, our best bet is to do this in Excel.
For this analysis, I used Microsoft Excel 2016 for windows. Depending on the version you are using, there may be a slight difference but the outcome should be the same.
-
Save your SPSS file in a format that can be opened in the version of Excel you are using.
-
Open the saved file in Excel and navigate to a new column. For this example, am using column W.
In cell W2, type the function =COUNTBLANK(A2: V2) and hit enter.
A2: V2 is a range of data for the first respondent in your dataset.
Now drag this property down the cells to the last respondent.
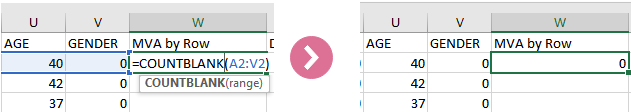
The number of unanswered questions for each respondent will show up, otherwise, the result will be zero (0) indicating all questions have been answered or no missing value. Since we have already replaced all missing values, the result is zero.
Typically, when respondents fail to answer at least 20% of the questions, you may delete that respondent or case from the analysis.