P values
P-value is also known as probability value and it ranges from 0 to 1. The interpretation of a p-value varies depending on what one is studying. For instance, while a small p-value less than 0.05 provide good evidence against the null hypotheses for ANOVA, t-test, Pearson’s correlation, regression analysis, etc., in some cases such as the statistical test for normality assumption (Kolmogorov-Smirnov and Shapiro-Wilk test), a p-value greater than 0.05 is a good indication that the data is normally distributed (i.e. higher level of significance). This p-value we are talking about is present in any statistical software you can think about.
Quick Facts
A smaller p-value provides greater statistical compatibility of the data with the proposed research hypothesis (alternative hypothesis) given that the assumptions underlying p-value are valid. Hence, providing enough evidence in favour of your hypothesis. P-value has nothing to do with the hypothesis you are testing or observing (alternative hypothesis). In other words, it does not tell you whether or not a given hypothesis is true. Instead, it gives you information about the odds of observing that hypothesis (null hypothesis). For example, a p-value of 0.01 means that there is a 1% chance that the null hypothesis will be rejected incorrectly and 99% evidence in support of the alternative hypothesis.
A p-value does not tell us the relative importance of a variable neither does it provide information on the size of an effect on a variable. For example, consider the variables A and B. Variable A has a p-value of 0.002 and variable B has a p-value of 0.03. The fact that the p-value of A is smaller than B doesn’t necessarily mean A is more important than B neither does it mean A exert a larger effect than B. You see, the reason why you need to take this seriously is that your sample size and the accuracy of your measurement instruments influence the p-value.
Always remember that p-value is not the only way to conclude your study or research. You can as well solidify your research findings by using predictive or confidence intervals, likelihood ratio, false discovery rate, etc.
Let’s understand this using a practical example:
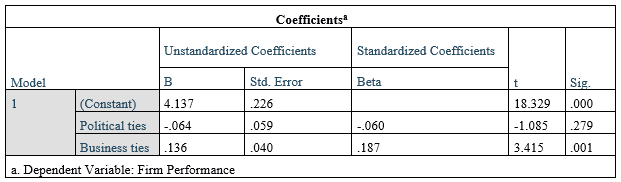
In the SPSS output above, the p-value is listed under the column Sig. We can see that the p-value for business ties is 0.01 which is less than 0.05 (a common threshold, you can choose your threshold, for example, 0.10 or 10%) and very significant. This means that there is a 0.01 or 1% chance (a very small chance) that the result on business ties (data on business ties) occurred by chance and 99% this result did not occur by chance.
In the same way, you can see the p-value on political ties is .123 which is greater than 0.05, hence not significant. In other words, there is a .123 or 12.3% chance the results of political ties occurred by chance exceeding the 5% threshold. Thus, we reject that hypothesis and conclude the political ties doesn’t influence firm performance positively.