Reliability Analysis in SPSS
In the steps that follow, I will show you how to determine the reliability of each construct and that of the research model using Cronbach alpha (α). Don’t know what reliability means? Click here.
- Click Analyze → Scale → Reliability Analysis. You should be presented with the window below.
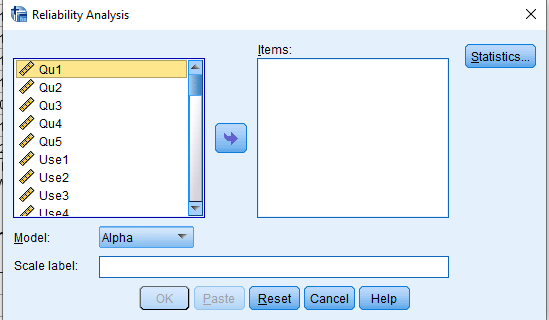
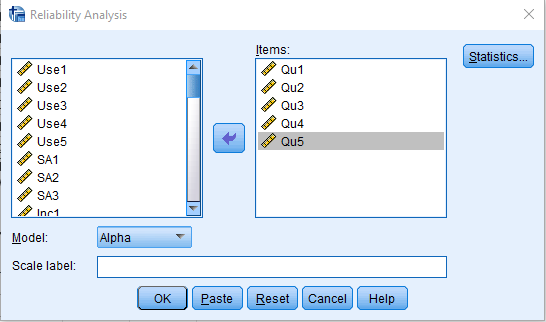
- Let’s investigate the reliability of each construct. Select the items measuring each construct and move them into the Items box. We can start with perceived quality of information in Wikipedia (Qu1 - Qu5).
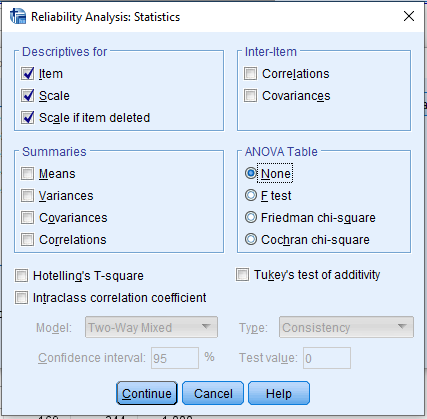
- Next, select Statistics, under Statistics for tick Item, Scale and Scale if item deleted as shown in the figure below.
- In your output, you will be presented with a number of tables, we are interested in
- Reliability Statistics
- Item Statistics
- Item-Total Statistics
Now, let’s look at the meaning of these tables.
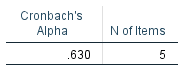
Table 1 represents the reliability statistics of perceived quality of information in Wikipedia (Qu1 — Qu5). In this table, we have the Cronbach’s Alpha (0.630) and the number of items (N of items) measuring Qu (5). The reliability (internal consistency) of Qu is 0.630 which is below the recommended threshold of 0.70. Thus, we have an internal consistency problem. We will rectify this problem soon.
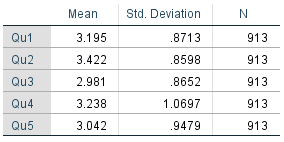
Table 2 shows the Item Statistics (Mean, standard deviation and sample size, N) for each of the items (or questions). Considering all the five questions, on average the respondents were Neutral to each of these questions and hence choose 3 on the Liker scale. Also, the standard deviation for all the questions is approximately 1, this means the questions asked are closely related.
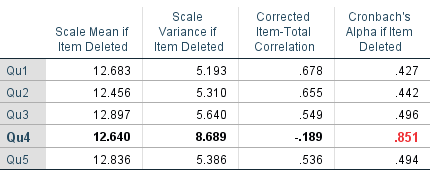
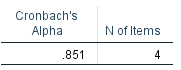
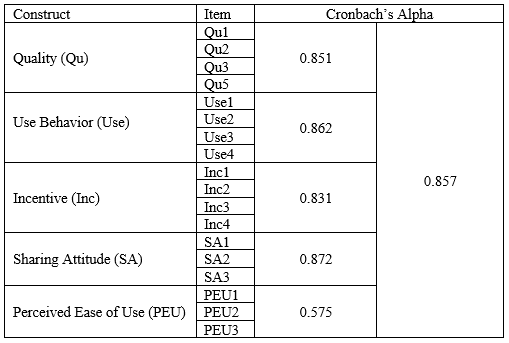
This table is a little tricky but don’t worry, you will get to understand shortly. From Table 1, the reliability statistics is 0.630, now from the analysis we did here, looking at the construct Qu, we deleted (or removed) item Qu4 from the analysis and we do not have to include it in future analysis. Removing Qu4 from this analysis scales the Cronbach’s Alpha to 0.851 which satisfied the recommended threshold. So, the inclusion of Qu4 in the analysis was the problem.
Yeah, so do this and repeat Step 2. See Table 4 for the final output.
You need to do this for all the constructs in your study.
The Cronbach Alpha value for PEU is 0.575, which doesn’t meet the required threshold. Since we have only three items measuring PEU, I will retain it and give an argument to support it.
It is true that when all the constructs are reliable, the whole model will also be reliable. See our output for the reliability statistics for the whole model. Remember to exclude those items that were removed during your loading and cross-loading analysis
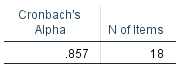
As you can see, the internal consistency for all the items or questions is 0.857.
Finally, create a table and record all your output. Personally, I prefer it this way (see table 6).
Yeah, so that’s all for now on how to find the reliability or internal consistency for your data.