Factor loading and Cross-loading
Because constructs are measured indirectly, it is recommended that you have at least three items/indicators/questions measuring each of them.
For example, in the data used for this post, university faculty members were asked about their perceived quality of information in Wikipedia using the following five different questions.
QU1: Articles in Wikipedia are reliable
QU2: Articles in Wikipedia are updated
QU3: Articles in Wikipedia are comprehensive
QU4: In my area of expertise, Wikipedia has a lower quality than other educational resources
QU5: I trust in the editing system of Wikipedia
Their responses were recorded on a five-point Likert scale ranging from Strongly Disagree (1) to Strongly Agree (5). So, all these questions are measuring the construct Quality and they are coded as QU1 (Question 1) to QU5 (Question 5). If these five items or questions are really measuring Quality, we must expect them to have a very high score on Quality. We call these scores, factor loadings or loadings. Preferably, we expect these loadings to be above the threshold of 0.6. Similarly, we shall expect these items to have very low loadings with other constructs, a term known as cross-loadings.
In this tutorial, we shall learn how to find the loadings and cross-loading for your data using SPSS. You can follow along by downloading the dataset.
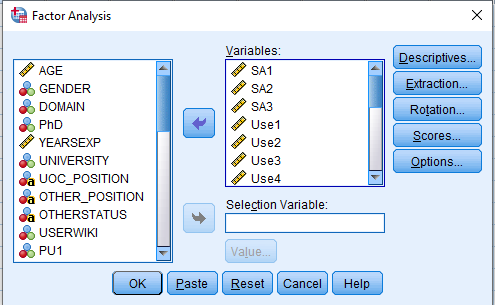
- In SPSS, click Analyze → Dimension Reduction → Factor. You will be presented with the window below.
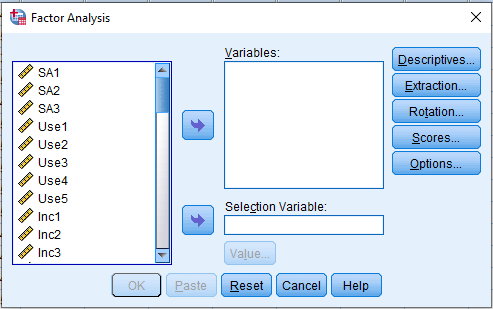
- Move all the items meauring a particular construct into the Variables: box.
-
Click on;
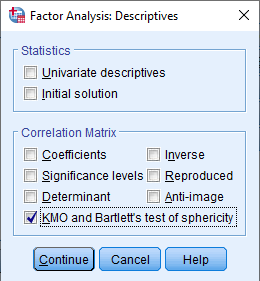
(a) Descriptives: select KMO and Battlet’s test of Sphericity, then click Continue
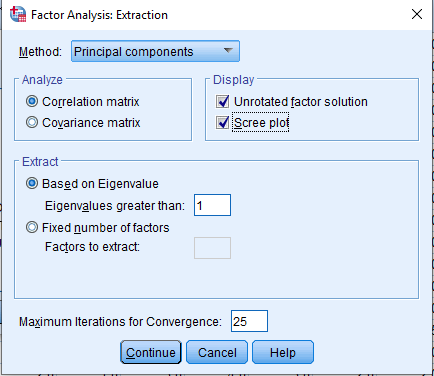
(b) Extraction: select Scree Plot, click Continue
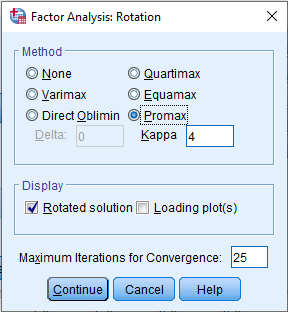
(c) Rotation: select Promax, click Continue
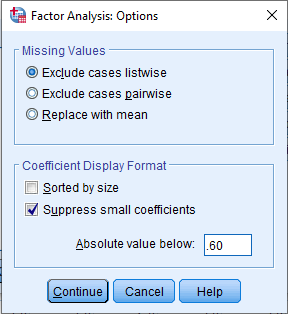
(d) Options: This section is optional but very helpful at the initial stage of identifying high loadings; you can use it when you want to print out factor loadings that exceed a particular threshold. Tick Suppress small coefficients, then under *absolute value below: change
0.10 → 0.60because we don’t want to print out loadings below 0.6.
- Click Continue and then OK.
You will be presented with so many tables. At the moment, our focus is on loadings and cross loadings so lookout for Pattern Matrix (this is our factor loadings and cross-loadings).
With the exception of the first column, the number of columns you have must be the same as the number of constructs. For example, in the questionnaire, we have five constructs (see data source for description), hence we must expect five different columns. Each column is representative of each construct. The idea is to make sure all the items measuring a construct have higher loadings in ONLY one column (preferably greater than 0.6) and smaller loadings with other constructs. If an item or items from a particular construct measure strongly (above 0.60) on another construct, delete (remove) that (those) item (s) from your analysis in Step 2, one at a time. For each item removed rerun the analysis, repeating Step 2 until you get the desired output. The minimum number of items for each construct must be 3.
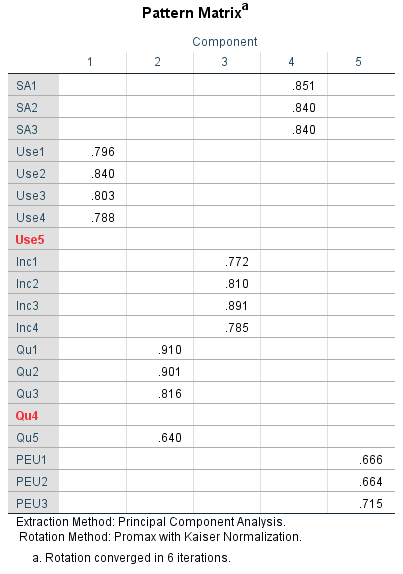
From the Pattern Matrix table, you can see that
Use5: I agree my students use Wikipedia in my courses and
Qu4: In my area of expertise, Wikipedia has a lower quality than other educational resources
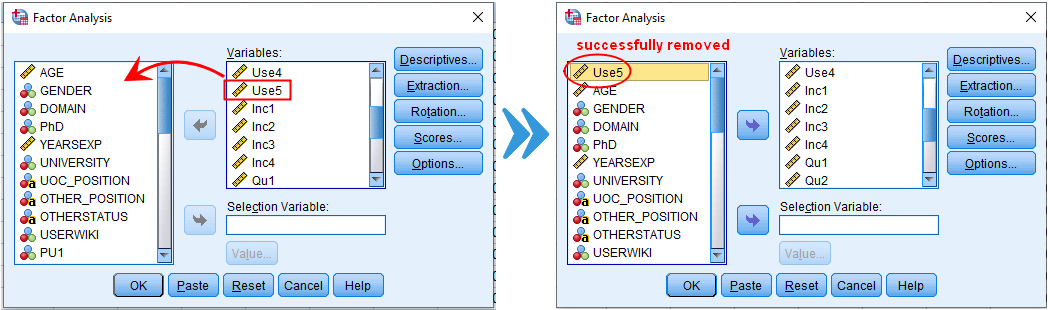
have no loadings (just that their loadings are below 0.6), so we delete them one at a time. You can do this by first removing either of them from the Variables section (see the figure below for details). Repeat this for Qu4.
The final output is shown below.
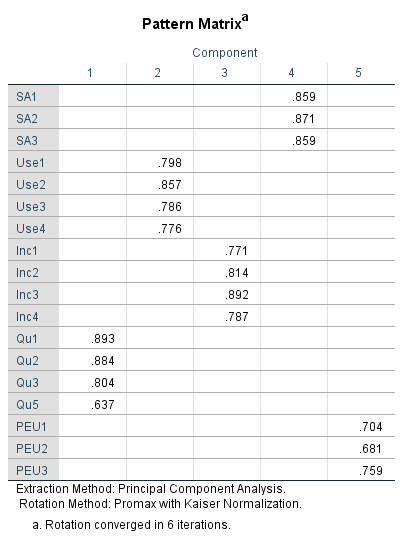
Great, now everything looks good.
Now, in step 3 (d), we can untick Suppress small coefficients, re-arrange the variables and then rerun the analysis to get the output below.
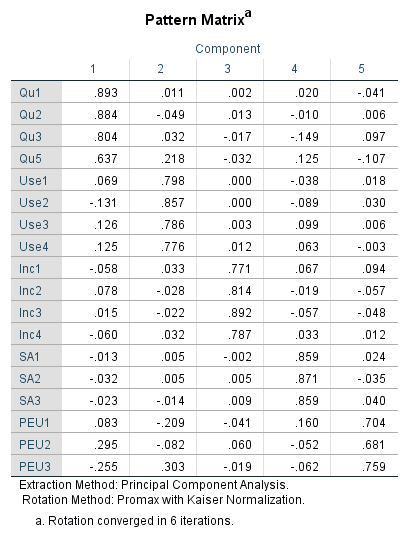
The table above doesn’t look very much presentable and quite confusing. Isn’t it? Yes, so you can copy the output into any word document then format it to look beautiful and very much presentable as shown below.
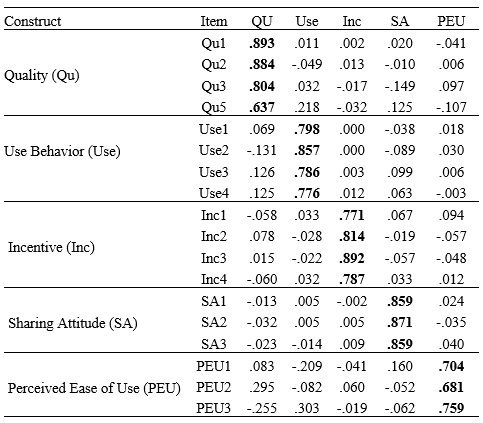
Under constructs we represented Qu1, Qu2, Qu3 and Qu5 as Quality (Qu) etc. The columns have also been labeled accordingly to reflect their exact meaning. Bolded numbers are the factor loadings, otherwise cross-loading
Table 1 gives an overview of the items that measure highly on a construct. Ones this is done, you will be able to decide which question(s)/item(s) in your questionnaire do not measure what it was intended to measure. This could be due to misunderstanding from the respondent while filling the questionnaire or the question was not well structured by the researcher. If you are able to get this out of your data, then you may proceed with your exploratory factor analysis (EFA).