Scree Plot
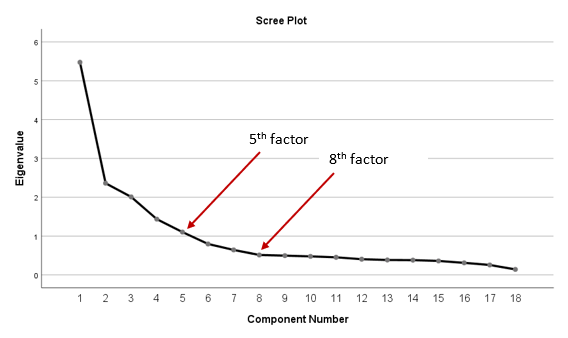
In exploratory factor analysis (EFA) , a scree plot is a plot of eigenvalues of factors arranged in descending order of magnitude from the left to the right side of the plot. The idea is to find out the number of factors that can be retained by identifying the point of inflexion (where the curve flattens) of the factors. So, the number of factors before the curve flattens represents the significant number of factors to be extracted for your factor analysis.
It is important to note that scree plot is sometimes difficult to read because the point where the curve flattens is subjective.
The subjectivity of the scree plot is evident in the ouput we obtained below. A careful look at this plot shows that the curve begins to flatten at the eighth factor while the exact number of factors extracted is 5. So, you ought to be careful whenever you interpret result using a scree plot.
